| McSwiggen & Associates |
 |
 |
 |
 |
 |
 |
 |
 |
| /Tech Notes/Quantitative Analysis |

|
1) Determine what elements are to be analyzed (see Qualitative Analysis).
|
2) Check for peak overlaps.
|
3) Standardize for all the elements being analyzed.
|
4) Make the measurements on the unknowns.
|
5) Determine the k-ratios for each element.
|
6) Correct the k-ratios for the difference in the matrix effects of the unknown relative to the standards.
|
back to top |
How do we know if our results are good? 1) Look at the totals.
2) Check the stoichiometry.
|
weight percent of each oxide
| SiO2 | 67.70 |
64.17 |
51.15 |
| Al2O3 | 19.89 |
18.66 |
31.35 |
| Na2O | 11.52 |
0.37 |
6.01 |
| K2O | 0.00 |
16.79 |
0.75 |
| CaO | 0.57 |
0.03 |
10.89 |
| Total | 99.67 |
100.03 |
100.15 |
| Si | 2.970 |
2.975 |
2.329 |
| Al | 1.028 |
1.020 |
1.682 |
| Na | 0.980 |
0.033 |
0.531 |
| K | 0.000 |
0.993 |
0.044 |
| Ca | 0.027 |
0.001 |
0.531 |
| O | 8.000 |
8.000 |
8.000 |
| Si+Al | 3.999 |
3.995 |
4.011 |
| Ca+Na+K | 1.007 |
1.028 |
1.105 |
By just looking at just the totals, all three analyses look like they are good analyses. However some elements could be high, but be hidden by the fact that other elements are low. The stoichiometry given us more information about the quality of the analyses. Since these are feldspar analyses in the ternary system CaAl2Si2O8 - NaAlSi3O8 - KAlSi3O8, the atom abundance Si+Al should always equal 4, and the abundance of Na+Ca+K should always equal 1. Using these rules, one can see that the first analyses is very good, the second one is off a little and the third analyses is off by a significant amount. |
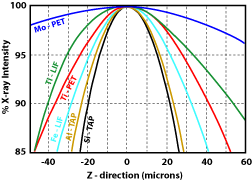
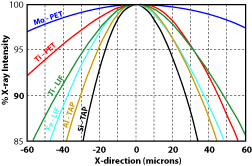
1) Were all the elements analyzed for? This will make for low totals and may adversely affect the matrix correction routines. 2) Was the sample in optical focus? When doing WDS analyses, the point the beam hits the sample must be on the Rowland circle, otherwise the generated X-rays will not enter the detector. The spectrometers are aligned so that when the sample is in optical focus, the sample at the cross hairs will be on the Rowland circle. Moving the stage either up or down will result in a loss of counts. Figure 1 shows how rapidly the counts will drop for a number of different X-ray lines. 3) Is the beam on the cross hairs? The same problem will occur when the beam is off of the cross-hairs as when the sample is out of optical focus. Specifically the spot generating the X-rays will not be aligned with the spectrometers. As a result there will be a drop in the number of measured X-rays (Fig. 2). This decrease will increase with distance from the cross hairs, and will vary with the X-ray line. 4) Was the standardization done properly?
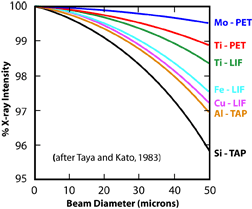
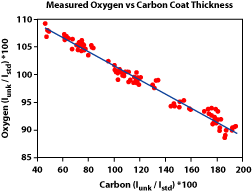
5) Was the beam diameter the same during the analyses as was used during the standardization? Using a larger beam diameter during the analyses will mean that some of the X-rays will be generated off of the Rowland circle, and therefore fewer will enter the detector. It's important to note that the drop in counts is not uniform from element to element (Fig. 3). This means that the element ratios will change. 6) Was the beam current and accelerating voltage appropriate for the analyses? Generally an accelerating voltage is used that is at least 2.5 - 3 times the excitation energy of the X-ray line being measured. An accelerating voltage too low will not produced the desired X-rays. A voltage too high will increase the likelihood of volatilizing the sample. Similarly, setting the beam current too high can also cause the sample to volatilize or for elements, such as Na, to migrate away from the beam. In either case, poor analyses will result. 7) Was too little of too much carbon used in the conductive coating? Non-conductive samples must be coated with a conductive surface before analyses. The coating is usually carbon, because it is a low atomic number element, and therefore will have less of an effect on the analyses. However, it is still important that the same thickness of carbon be used on both the standard and the unknown sample. Using too little or too much carbon can have a very large effect on light element analyses (Fig. 4). For these analyses, it is best to carbon coat the standard and unknown at the same time to ensure the same thickness is obtained. 8) Other sample preparation problems.
|
Figure 1. Variation in X-ray counts with distance from the optical focus point (after Taya and Kato, 1983).
Figure 2. Variation in X-ray counts with distance the beam is from the cross hairs (after Taya and Kato, 1983).
Figure 3. Effect of beam diameter
oxygen as a result of variations in the carbon coating thickness as measured by carbon abundance.
|
Toya, T. and A. Kato, 1983, Practical techniques for microprobe analyses: JEOL part number 270195, 193p.