| McSwiggen & Associates |
| /Tech Notes/Line Analysis |

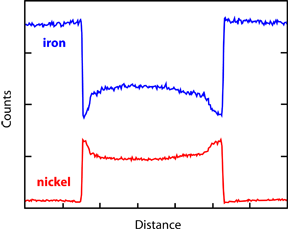
Line analyses show the change in the concentrations of given elements along a line traversed across a sample. The example in Figure 1 was measured across an exsolution lamellae in a sample of the Estherville meteorite. It clearly shows that the lamellae in the center of the profile contains more nickel and less iron than the surrounding matrix. It also shows that along the edge of the lamellae the nickel increases even more and the amount of iron drops. Profiles such as this have been used to determine the cooling history of the meteorite (see Estherville Meteorite Cooling History). Line profiles can be done in a quantitative, semi-quantitative, or qualitative manner. A qualitative line analysis would consist of setting each spectrometer to an element, and then quickly scanning the beam across the sample (beam scan) or by moving the sample back and forth under a fixed beam (stage scan). The results would be reported as raw X-ray counts for each element. This type of analysis is very rapid and quickly shows the user any compositional variations along the chosen path. The results can be converted into a semi-quantitative line profile by using a calibration curve generated from standards to convert the X-ray counts into weight percents. |
Figure 1. Line analysis for iron and nickel a |
Semi-quantitative line profiles are typically not background corrected nor corrected for matrix effects. To determine a quantitative line profile, a series of point quantitative analyses are done along the line of interest. These would then be corrected for both the background and matrix effects, and could be plotted for display as a line profile. The advantage of a line analysis is that it can show the compositional variations across an area in a fraction of the time that it takes to run a map analysis. |
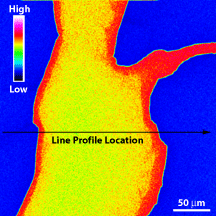
Figure 2. Location map for the line |


